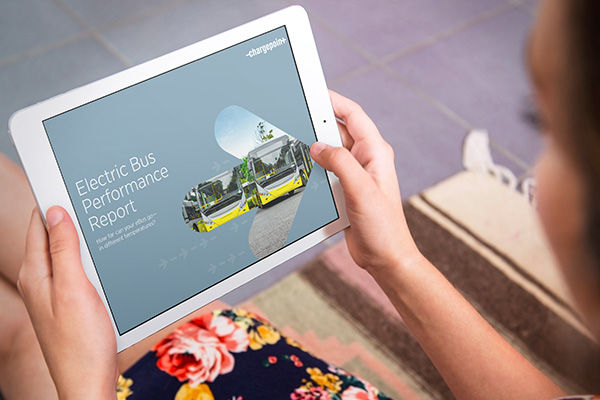
Electric Bus Performance Report
With thousands of electric buses and chargers connected to our fleet management platform, we can use our data at a larger scale to deliver insights for the industry as a whole.
This free report tracks the performance of about 100 eBuses in the Netherlands to understand electric bus efficiency. The relatively flat landscape eliminates terrain differentials and ensures an accurate comparison between routes. We tracked 12-meter and 18-meter buses driving up to 500 km a day and operating in temperatures as cold as -10 °C or as hot as 29 °C.
We analyzed:
- 100 + electric buses
- over 10 months
- in 7 different cities in The Netherlands
But are operators using their buses to their full potential? Let’s take a look at the data to find out.
Free Download
In this report, you’ll discover:
- How far your eBus can go—in different temperatures
- What distance you can expect your eBus to cover across seasons
- How your eBus consumption fluctuates in different weather conditions

About ChargePoint
ChargePoint brings electric vehicle (EV) charging to more people and places than ever before with the world’s largest and most open EV charging network. We design, build and support all of the technology that powers this network, from charging station hardware to energy management software to a mobile app. Our work transforms transportation and energy use by helping more people choose to drive electric.
